I Shipped Production AI at Scale. Here Is What the Research Says Actually Drives Adoption.
A researcher who shipped 3 production AI platforms to 30,000 sellers in 2026 then quantified what drives adoption in 523 U.S. adults. Performance expectancy did not make the list. Three other factors did.
Quick decision summary
Five plain-language checks for a go or hold decision
- What claim are we testing?
- Operators who have shipped AI at production scale already know that capability claims drive adoption. The research confirms this.
- Who is the named peer?
- AIRS research: N=523 U.S. adults, Dr. Fabio Correa DBA, Touro University Worldwide, defended April 2026; practitioner anchor: Microsoft Director, 30+ years, 3 production AI platforms in 2026, ~30,000 sellers, ~175,000 commercial customers
- Source strength
- T1 T1 (named buyer on record with primary source)
- Where this may not apply
- U.S. adult sample, cross-sectional design, self-reported behavioral intention (not observed usage). Generalizes to populations with similar AI exposure patterns.
- Recommended decision
- The operator who shipped at scale and the structural model agree: performance specs do not predict adoption intent. Price value, hedonic motivation, and social influence do. Redirect investment toward those three levers before the next deployment cycle.
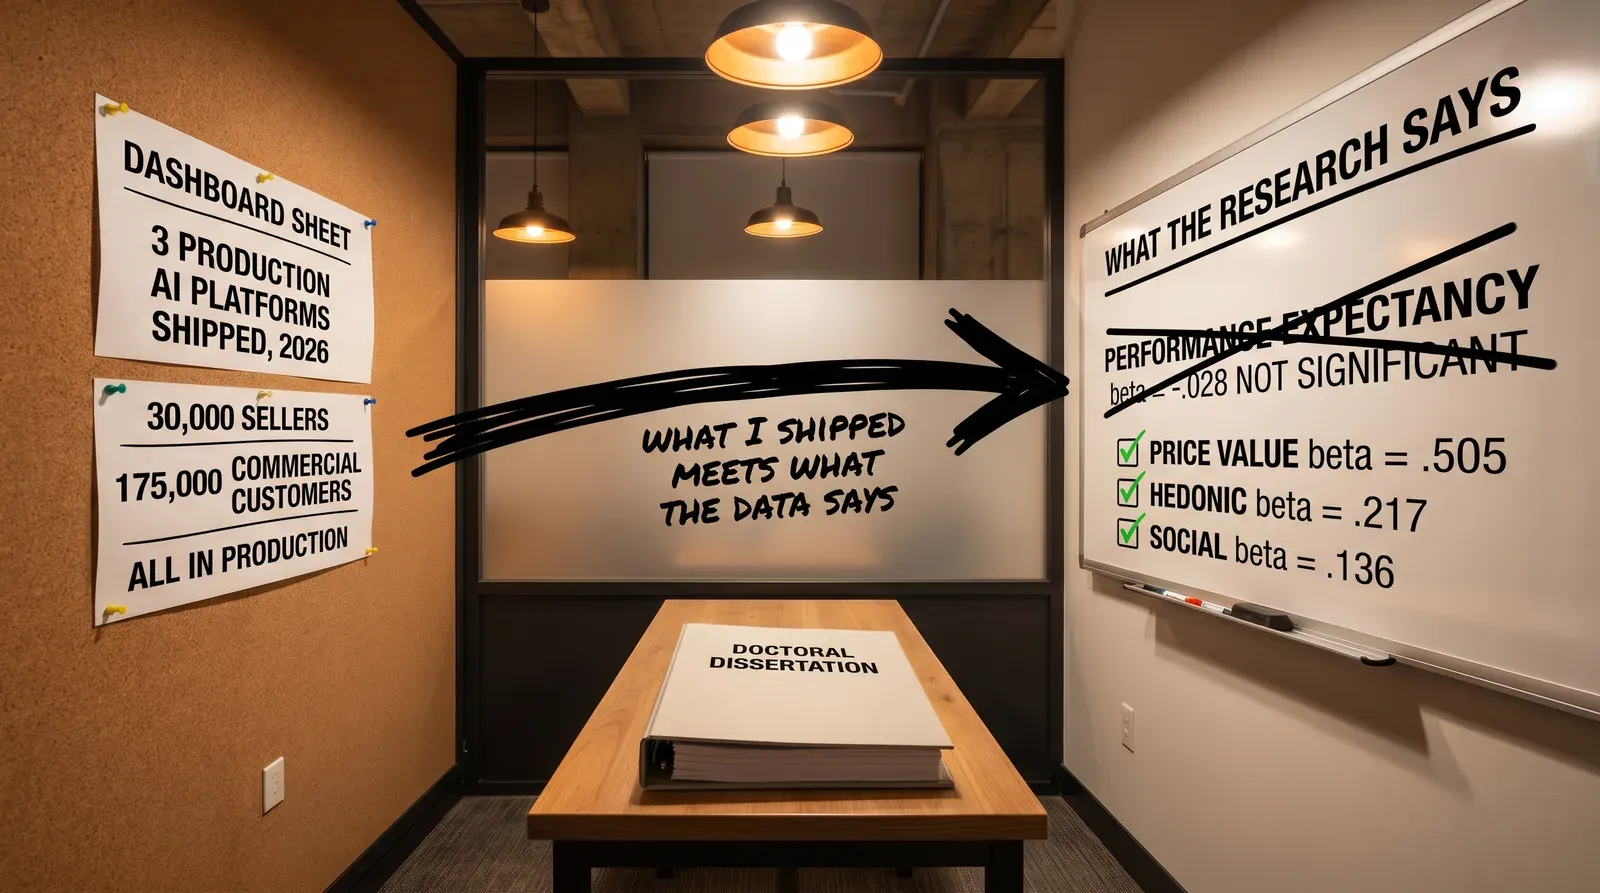
In 2026, I shipped 3 production AI platforms at Microsoft reaching roughly 30,000 sellers and 175,000 commercial customers. I do not speak about things I haven’t shipped. The work has to survive contact with a real customer for me to claim it.
So when my doctoral research found that performance expectancy does not significantly predict AI adoption intent (β = -.028, p = .791 in the N=523 sample), I had a useful reference point. I had watched that pattern from the inside. I just hadn’t quantified it.
Now it is quantified.
What the Model Found
The AIRS structural model tested eight factors against behavioral intention to adopt AI tools across 523 U.S. adults recruited in October-November 2025. The model explains 85.2% of variance in adoption intent. Eight predictors entered. Three came out supported.
Performance expectancy (PE) was not one of them.
PE is the belief that using an AI tool will improve job performance. It is the central claim in every enterprise AI sales pitch. It is what vendor benchmarks are designed to demonstrate. In this sample, it did not significantly predict adoption intent.
The three paths that did significantly predict in this sample:
- Price value (PV): β = .505, p < .001. The strongest predictor, by a wide margin. Users need to believe the tool is worth what they give up: time, disruption, cognitive overhead, the risk of looking less competent during the transition.
- Hedonic motivation (HM): β = .217, p = .014. Whether using the tool is enjoyable or interesting. Second strongest.
- Social influence (SI): β = .136, p = .024. Whether people whose opinions matter to the user are already using AI tools. Third strongest.
Five factors did not significantly predict in this sample: performance expectancy, effort expectancy, facilitating conditions, habit, and AI trust. Trust is a separate discussion: the effect was marginal and underpowered at this sample size, not absent. That matters for interpretation. It does not change the main finding on PE.
Why This Is Counter-Intuitive
Every enterprise AI program I have been inside leads with capability. ROI models open with productivity multipliers. Vendor renewals are defended with benchmark comparisons. The implicit logic is: if users believe the tool makes them better at their job, they will use it.
The structural model does not support that logic in this sample.
This is not entirely new. UTAUT2, the theoretical parent of AIRS, already found that PE effects weaken in voluntary-use contexts. What AIRS adds is a direct measure under current conditions, with a sample collected during high but uneven AI tool exposure across job roles. The model that explains 85.2% of variance would have found PE if it were a meaningful driver. It found three other things instead.
What Actually Drives Intent
Price value is doing most of the work. The construct is not about pricing. It is about a user-side calculation that happens whether or not your program accounts for it: is this tool worth what I give up?
Capability answers whether the tool can do the task. Price value answers whether adopting it is worth the personal cost. Those are different questions. Enterprise programs invest heavily in the first and routinely underinvest in the second.
Hedonic motivation and social influence are also load-bearing. Neither is a capability claim. Enjoyment is about the experience of using the tool. Social influence is about peer visibility, not executive endorsement.
Taken together, the three supported predictors point toward a consistent pattern: adoption intent is driven by personal experience and social context. Not by performance specifications.
Three Predictors, Three Design Inputs
Price value is a user-side calculation your deployment cannot avoid. What users give up is concrete: time to learn the new workflow, disruption to the familiar one, cognitive overhead of working differently, and the risk of looking less competent during the transition. A tool can be genuinely capable and still fail this test. If your deployment has not addressed that calculation directly, price value stays low regardless of the benchmark. The β = .505, p < .001 in the N=523 sample means this predictor accounts for more variance in adoption intent than any other factor tested. It is not a UX footnote.
Hedonic motivation is about whether the experience of using the tool is worth having, independent of the outcome. Enterprise programs almost never design for this. The signal appears in second-session rates: does the user come back after the initial onboarding? Low hedonic motivation does not announce itself as “the tool is unpleasant.” It appears as abandonment after week one, low voluntary usage in populations where the tool is not mandated, and support requests that are functionally requests to opt out. At β = .217, p = .014 in the N=523 sample, this is the second strongest predictor of adoption intent. It is a structural input, not a cosmetic one.
Social influence is peer visibility. Your governance rollout and leadership announcement do not move this predictor. What moves it is whether the person in an adjacent role is visibly using the tool and talking about it. Programs that deploy broadly and expect adoption to propagate on its own work against this predictor. Programs that seed visible peer cohorts first and instrument the social signal work with it. Deploying to twenty high-visibility users before expanding to two thousand is not a slower rollout. It is a different adoption design.
What This Means for Enterprise Programs
If your AI program is designed to drive adoption by demonstrating capability, you are working on the wrong input.
Capability appears to be a floor, not a driver. Once a tool crosses a basic competence threshold, additional capability claims do not move adoption intent in this sample. What does move it: making the personal cost-benefit calculation favorable, designing for an experience worth returning to, and creating visible social proof inside the user’s peer network.
At the next vendor meeting that opens with benchmark slides, one question is worth asking before the meeting ends: “What is your evidence that users who believe this tool improves their job performance adopt it at higher rates than users who do not?” The AIRS data puts that path at β = -.028, p = .791 in the N=523 sample. Not statistically significant. The benchmark answers a question that does not predict adoption. That is worth knowing before signing a renewal.
The budget case for your portfolio is not that the tools you are deploying are more capable than the alternatives. The case is that your deployments are designed so the personal cost-benefit calculation lands in favor of adoption, the experiences are worth returning to, and adoption is visible inside the peer networks of the users you are trying to move.
Three things to do differently this week:
First, if a vendor renewal is on your calendar this quarter, pull two data points before the meeting. Your internal adoption rate by business unit, with variance across units visible. And any signal on whether users in the low-adoption units believe the tool is worth the disruption cost. The vendor will bring benchmark slides. Those answer whether the tool can do the task. Your two numbers answer whether it is being used and why.
Second, if adoption telemetry only measures usage rate and task completion, add a user-perceived value signal before the next portfolio review. The question is not complicated: do users believe this tool is worth the disruption cost? If you do not measure it, you will not know why adoption stalls when it does, and you will not have a defensible answer in the funding-defense meeting when it does.
Third, at the next team lead meeting, identify the team with the highest voluntary adoption rate and ask them what changed. The answer is unlikely to be “we showed them better benchmarks.” The answer will name the experience, the peer network, or the value calculation. That answer is a design input for the next deployment, not a testimonial.
The research anchor: Dr. Fabio Correa’s DBA dissertation (Touro University Worldwide, defended April 2026) tested eight UTAUT2-based predictors of AI adoption intent across 523 U.S. adults recruited through Centiment, topic-blinded. The model accounts for 85.2% of variance in behavioral intention. The instrument is publicly available at airs.correax.com.
Funding Meeting Brief
| Field | Value |
|---|---|
| Claim being tested | Operators who have shipped AI at production scale already know that capability claims drive adoption. The research confirms this. |
| Named deployment peer | AIRS research: N=523 U.S. adults, Dr. Fabio Correa DBA, Touro University Worldwide, defended April 2026; practitioner anchor: Microsoft Director, 30+ years, 3 production AI platforms in 2026, ~30,000 sellers, ~175,000 commercial customers |
| Evidence tier | T1 |
| Transferability limits | U.S. adult sample, cross-sectional design, self-reported behavioral intention (not observed usage). Generalizes to populations with similar AI exposure patterns. |
| Defensible decision line | The operator who shipped at scale and the structural model agree: performance specs do not predict adoption intent. Price value, hedonic motivation, and social influence do. Redirect investment toward those three levers before the next deployment cycle. |
References
- AIRS instrument: AI Readiness Scale, correax.com, 2026-04-01
- AIRS research repository, GitHub, 2026-04-01